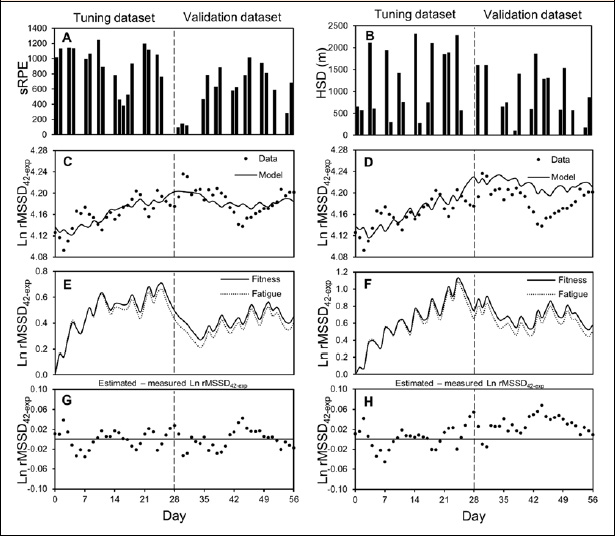
Figure 1. Application of the Banister impulse-response model to athlete #4. The left column pertains to sRPE training load data, the right column represents HSD training load data. Charts (A) and (B) display the daily training loads undertaken across the study period. Charts (C) and (D) display the fit between modelled and measured chronic HRV responses. Charts (E) and (F) display the fitness and fatigue influences on HRV. Charts (G) and (F) display the residual differences between measured and modelled HRV across the study period. Data to the left of the dashed vertical line relate to the tuning dataset, whilst data to the right of this line relate to the (unseen) validation dataset.