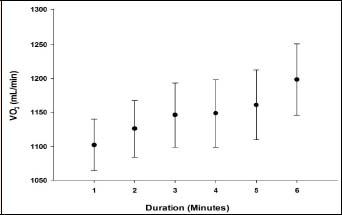
Figure 1.
Average V̇O
2
values for every min throughout the Fatmax stage.