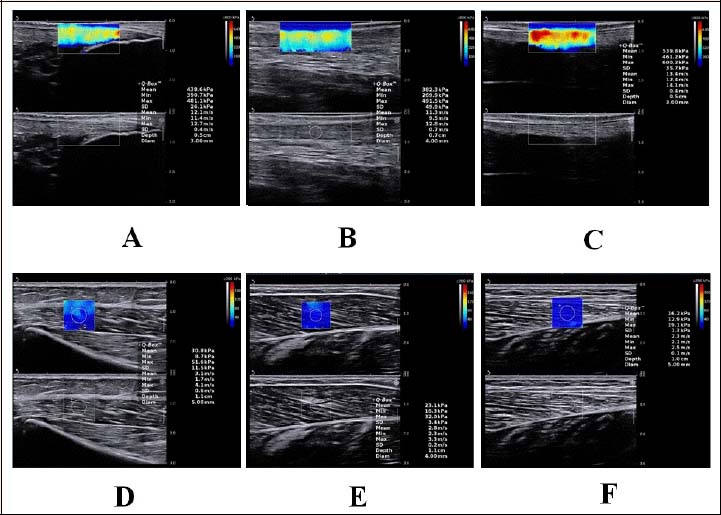
Figure 1. A longitudinal shear wave elastography scale sonogram of the AT and LG shows the measurement of the shear modulus at different regions (from A to F). The color-coded box presentation of muscle-tendon elasticity is shown in the upper images. The longitudinal grey-scale sonograms of muscle-tendon are shown in the bottom images. The Q-Box™ is shown on the right. A-C: the pre-stretching shear modulus values of AT0cm and AT6cm,respectively; D: the pre-stretching shear modulus values of proximal region of the LG; E: the pre-stretching shear modulus values of middle region of the MG; F:the pre-stretching shear modulus values of distal region of the LG.