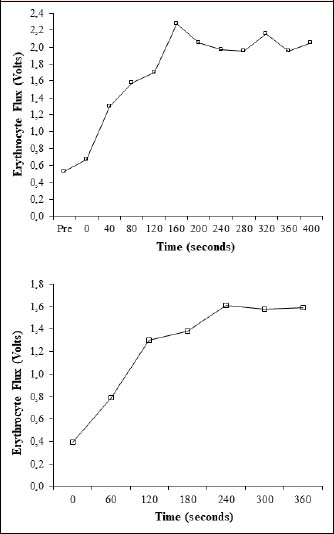
Figure 1.
Typical erythrocyte response to ACh (top graph) and SNP (bottom graph).