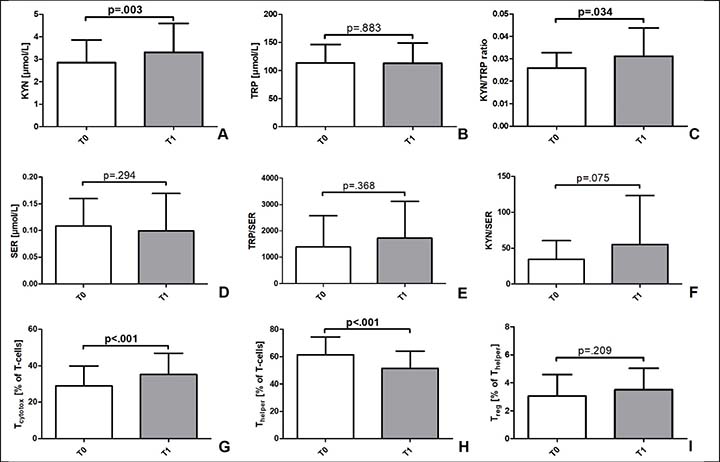
Figure 1.
Bar graphics of participants' blood markers (N=19) at T0 and T1. Values are presented as mean and standard deviation.