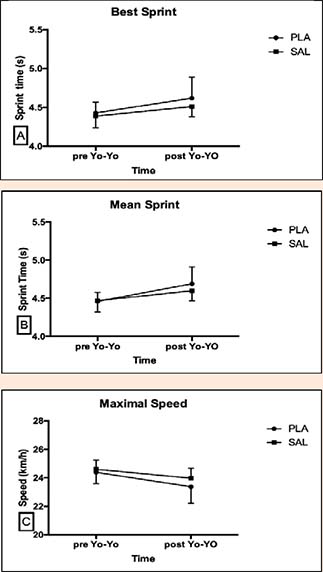
Figure 1.
Best Sprint (A), Mean Sprint (B), Maximal speed (C) at pre and post Yo-Yo IRT. Data are presented by Mean and SD.