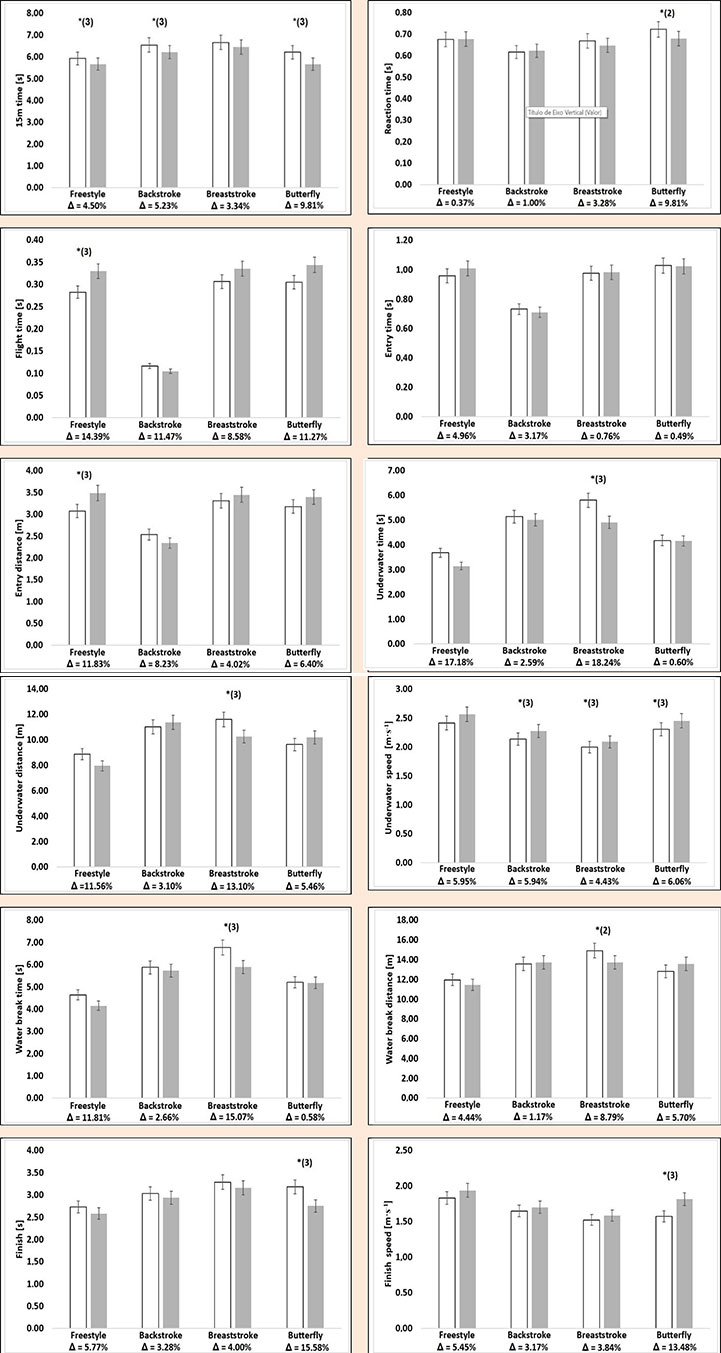
Figure 1. Males start and finish variables comparison between the 100 m and 200 m races (freestyle, backstroke, breaststroke, and butterfly). White background represents the 200 m races, and grey background the 100 m races (bars represent the 95% confidence interval). ∆ – relative difference; * – significant differences (p < 0.05); (2) – minimum effect size; (3) – moderate effect size; (4) – strong effect size.