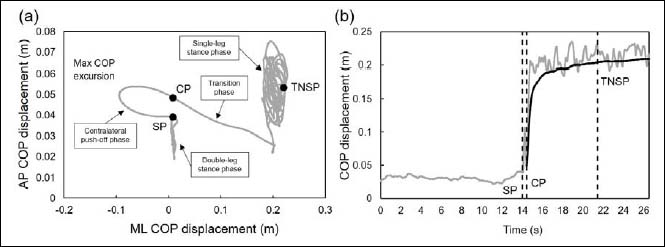
Figure 1. (a) Representative example of center of pressure (COP) displacement data (gray solid line) during the transition task from double-leg to single-leg stance. Black circles represent the time points of starting point (SP), crossing point (CP), and time to new stability point (TNSP). (b) Representative examples of sequential estimation (black solid line) and COP displacement data (gray solid line). Dotted vertical lines represent the time points of SP, CP, and TNSP. AP COP: anteroposterior COP; ML COP: mediolateral COP; Max COP excursion: maximum COP excursion during anticipatory postural adjustments.