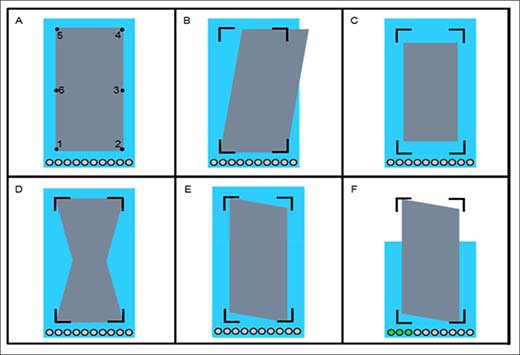
Figure 1. The stimulus used in the experiment. During the trials, the stimulus’ shape started as a rectangle. This shape is depicted in Panel A and was defined by points one through six. An outline of the shape’s corners (points one, two, four, and five) remained while participants were performing the squat exercise and are shown in Panels B-F. Also displayed are ten grey circles towards the bottom of each display. These were used for counting the number of squats within a block. As participants performed squats, the circles would change from grey to green. Depicted in Panels B-E are the effects of the trunk lean, KHMr, KAM, and vGRF variables, respectively. As participants deviated from the optimum value (see Table 1) the biofeedback display would react as shown in each panel; however, as the participants performed closer to the optimum value the display would begin to return to the goal shape shown in Panel A. In Panel F, the lighter background rectangle lowered from its maximum height (displayed in Panels A-E) as a participant performed the downward movement of a squat. Accordingly, the stimulus rose as a participant began to rise back up.