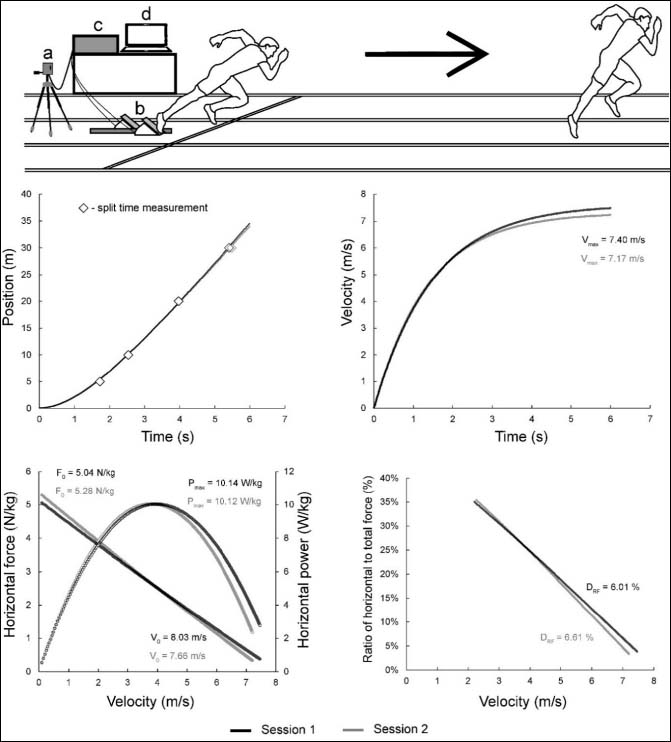
Figure 1. The split times were recorded with a laser distance meter (a). The participants started from the adjustable sprint blocks (b), and the data was stored via a data acquisition box (c) and immediately transferred to the personal computer (d) for inspection and later offline analysis. The charts depict the data of key outcome variables for a representative participant, obtained during the first (black color) and second (gray color) session.