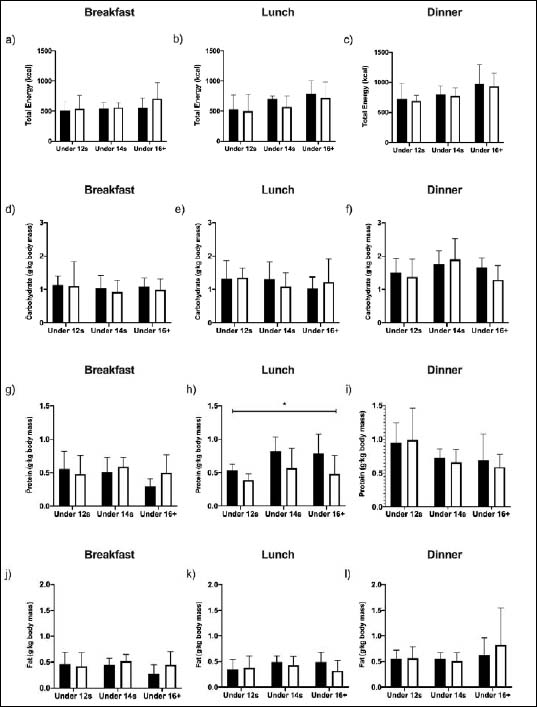
Figure 1. Total energy and relative macronutrient intakes for U12s, U14s and U16+ age groups during TDs and CDs. Black bars represent TDs and white bars represent CDs. Values presented as mean ± SD. * denotes a significant main effect of day (p<0.05) between all age groups. TD = training day; CD = competition day.