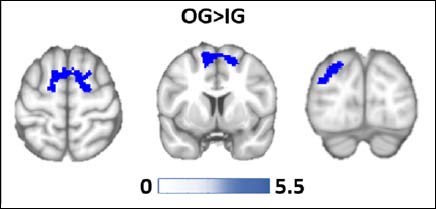
Figure 1. Between-group differences in the areas significantly activated while participants viewed green nature images versus urban images. The regions in blue indicate higher activation in the nature areas group than in the urban areas group. The right hemisphere corresponds to the right side of axial and coronal views.