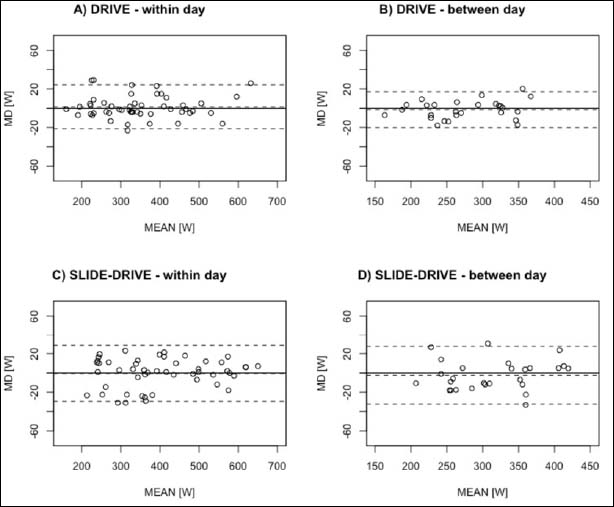
Figure 1.
Bland–Altman plots (MD: mean difference between both devices; MEAN: average of both devices) for the within and between day reliability of DIRVE (A and B) and SLIDE-DRIVE (C and D).