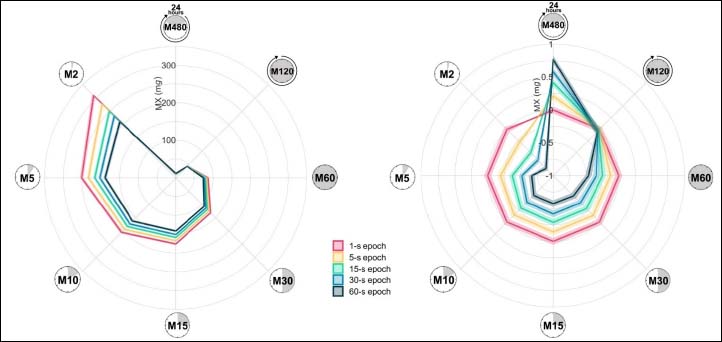
Figure 1. Illustration of the physical activity profile for raw (left) and standardised (right) MX metrics in females and males across 5 different epoch lengths. Profiles are presented for physical activity data averaged over 1-s, 5-s, 15-s, 30-s, and 60-s epoch lengths. Values are the mean; error ribbons are the standard error of the mean. Standardised metrics were standardised based on the 1-s epoch data. The MX metrics show the acceleration above which an individual’s most active X minutes are accumulated. Each plot shows (clockwise) M480, the intensity above which an individual’s most active 480 minutes are accumulated; M120, the intensity above which an individual’s most active 120 minutes are accumulated; M60, the intensity above which an individual’s most active 60 minutes are accumulated; M30, the intensity above which an individual’s most active 30 minutes are accumulated; M15, the intensity above which an individual’s most active 15 minutes are accumulated; M10, the intensity above which an individual’s most active 10 minutes are accumulated; M5, the intensity above which an individual’s most active 5 minutes are accumulated; M2, the intensity above which an individual’s most active 2 minutes are accumulated.