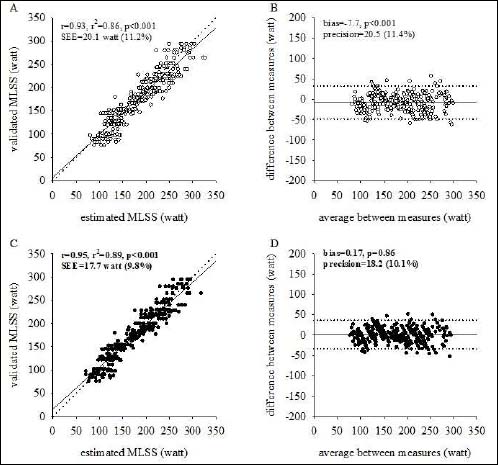
Figure 1. Left panels: Individual validated Maximum Lactate steady-state (MLSS) values are plotted as a function of estimated values based on the original equation proposed by Fontana MLSS (â—‹, panel A) and the new equation that incorporates age, sex and the trial absolute load (â—, panel C). The identity (dashed) and the regression (solid) lines are displayed along with the coefficient of determination. Right panels: Individual differences between the values of validated MLSS and estimated values based on the original equation proposed by Fontana MLSS (â—‹, panel B) and the new equation (â—, panel D) are plotted as a function of the average of the two measures. The solid lines correspond to the average difference between measures (i.e. bias) while the dashed lines correspond to the limits of agreement.