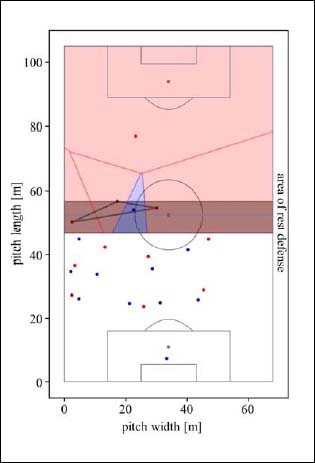
Figure 1. Illustration of an identified rest defense situation with the blue team gaining the ball (black) and the red team losing the ball in the attacking third with the opposing midfielder-line being overplayed. The considered area of rest defense is shown in grey (ten meters in front of the deepest defender), the surface area of rest defending players is depicted with grey lines, and the space control of the teams in the rest defending playing area is depicted in blue and red, respectively.