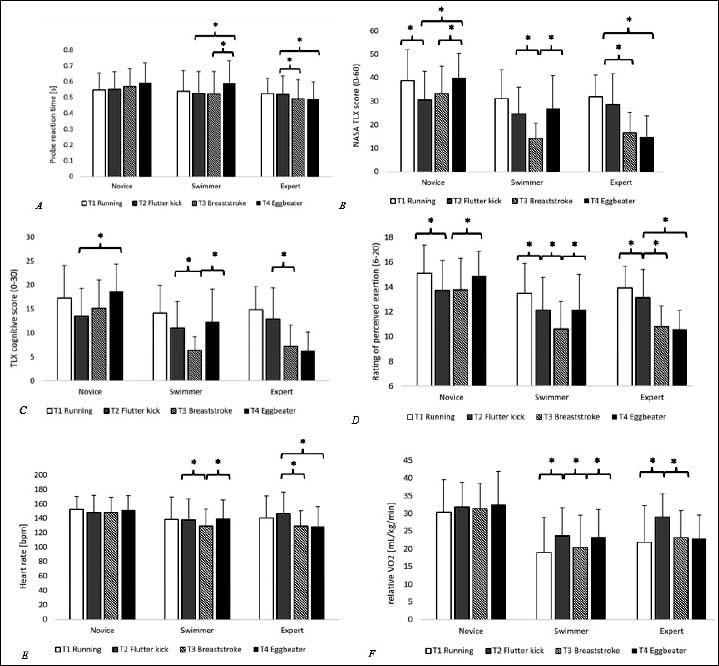
Figures 1. a-f. Mean values in main variables for each group and treading pattern. Variables presented: a) probe reaction time, b) NASA TLX raw, c) TLX cognitive score, d) rating of perceived exertion, e) heart rate, f) relative V̇O2. Error bars indicate one standard deviation. Note: The V̇O2 values presented in this graph were standardised by dry weight to allow more intuitive understanding of the data; however, the wet weight-standardised data were used for analyses.