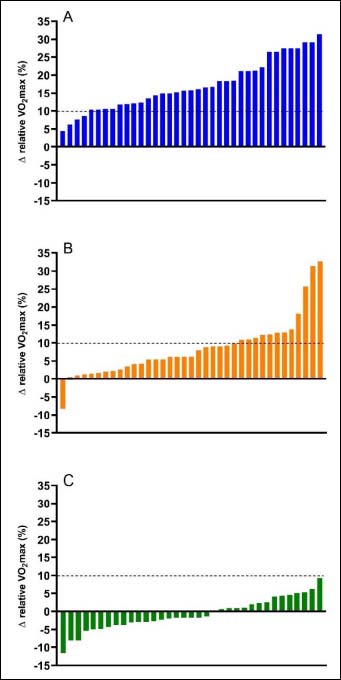
Figure 1.
Changes in percent VO
2
max for individual participants in A) the THRESH, B) STND, and C) Control groups. The horizontal black dashed line at 10% represents the demarcation for clinical meaningfulness in changes in percent VO
2
max.