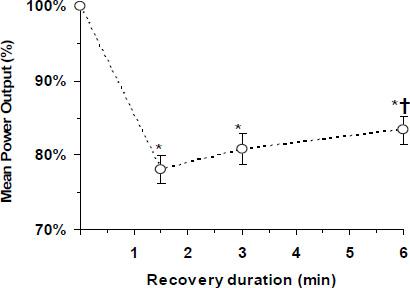
Figure 2. Recovery of mean power output during two 1000 m bouts of rowing exercise separated by 3 different recovery intervals. Results are presented as a percentage of power output during bout 1. * denotes p < 0.01 compared with bout 1, † denotes p < 0.01 compared with bout 2 after 1.5 min recovery.