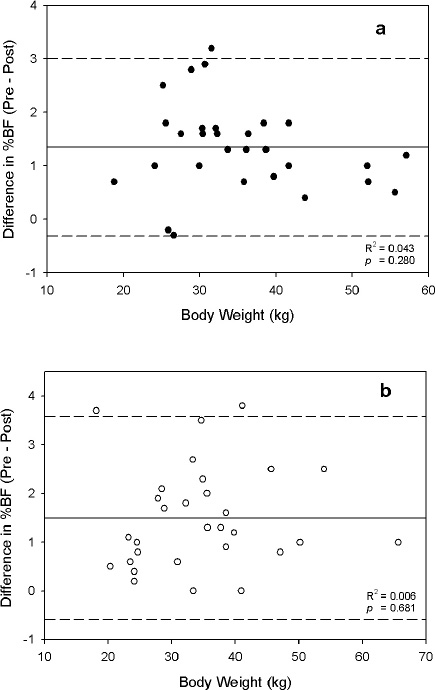
Figure 2. Scatter plots exploring individual differences in %BF following intermittent sub-maximal treadmill exercise. The difference between pre- and post-exercise %BF is plotted against body weight for the female (â—; a) and male (â—‹; b) children. Values greater than zero indicate a decrease from pre- to post-exercise. The mean difference is represented by the solid line, and the dashed lines represent ± 2 SD from the mean.