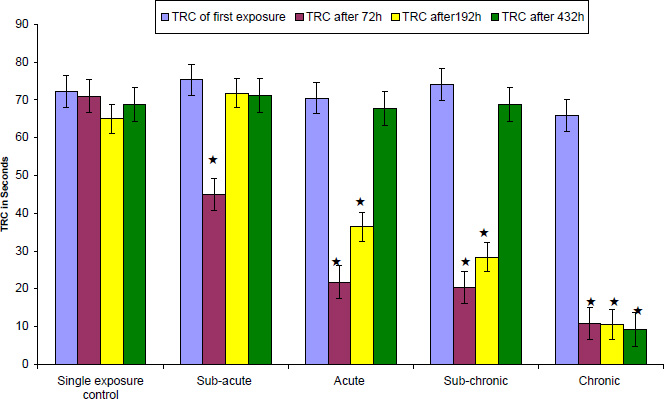
Figure 2.
Effect of single, sub-acute, acute, sub-chronic and chronic exposure on TRC of rats using Hebb-Williams maze. Values are means ± S.E.M. denotes p < 0.001 when compared with first exposure group.