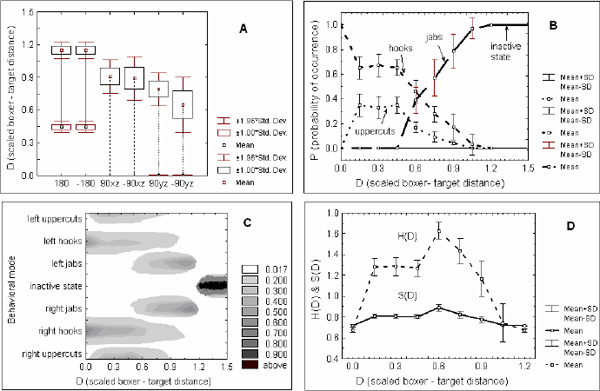
Figure 2A-D. A) Bounded regions of the scaled boxer - target distances (D) of the first time activations and annihilations of the boxing action patterns are given by box and whisker plots. The vertical solid lines correspond to the activity region of the right jabs (180) and left jabs (-180); dashed lines to the activity region of the right hooks (90) and left hooks (-90) and the longer dashed lines to the activity region of the right uppercuts (90) and left uppercuts (-90). It can be observed that the first time activations (given by the upper group of box and whisker plots) and the dissolutions of the action modes (given by the lower group of box and whisker plots) arise for different values of the scaled boxer - target distances; B) Probabilities of occurrence of the boxing action patterns as a function of the scaled boxer - target distance. The polarized structure of the probability of occurrence of the punching modes is readily observable; C) Branching (bifurcations) of the movement solutions to the punching training task. Legend on the right corresponds to the probability of occurrence of the behavioral modes. D) The change of the entropy H and symmetry S measures as a function of the scaled boxer - target distance D. For both measures the maximum is around D = 0.6 pointing to the region of maximal selection meta - stability (i.e flexibility of switching) between the boxing action modes.