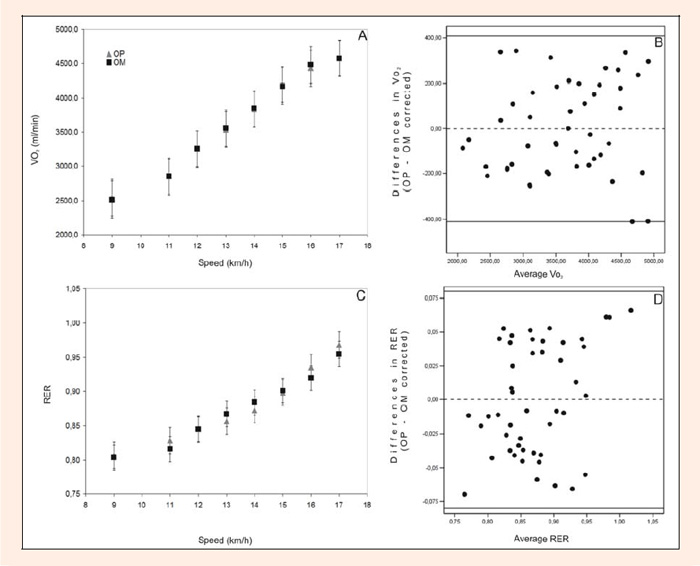
Figure 2.
Left panels show mean and standard deviation values measured by OP or OM. Right panels show Bland and Altman plots depicting absolute differences in values between OM and OP corrected with proposed ecuation. (A) VO; (B) RER.