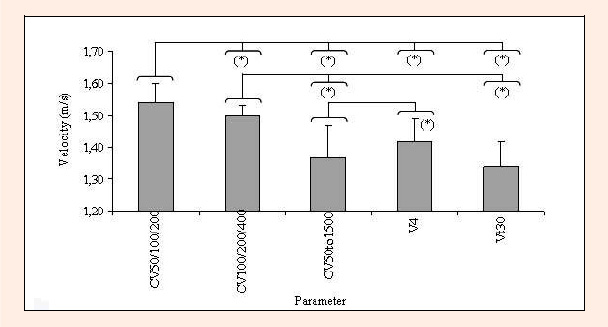
Figure 2.
Mean ± SD values for the velocities that were considered in the study and statistical differences between the values of each velocity. * p ≤ 0.05.