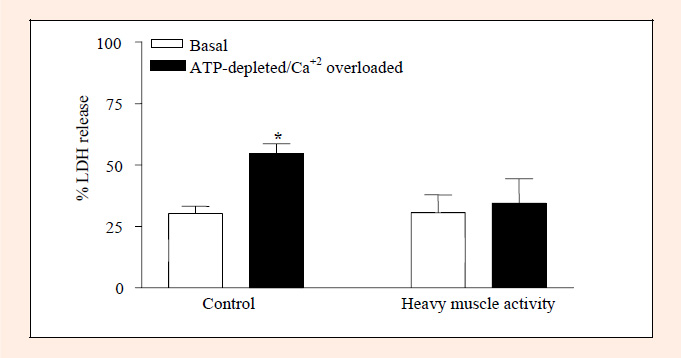
Figure 2.
Statistically different from individual basal conditions; * p < 0.001.