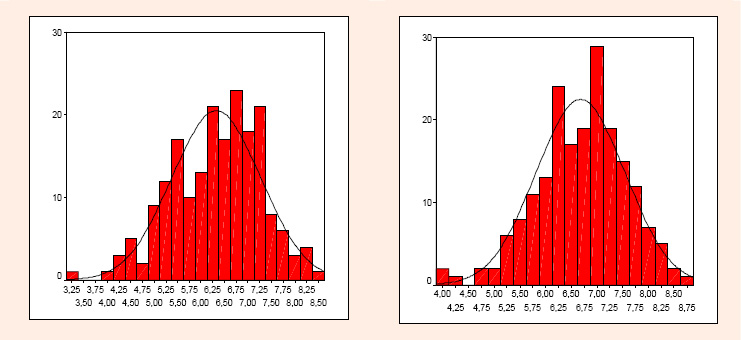
Figure 2.
Diagram of the frequency distributions of the divergent (left; = 195) and convergent (right; = 195) performance parameters with the respective normal distributions.