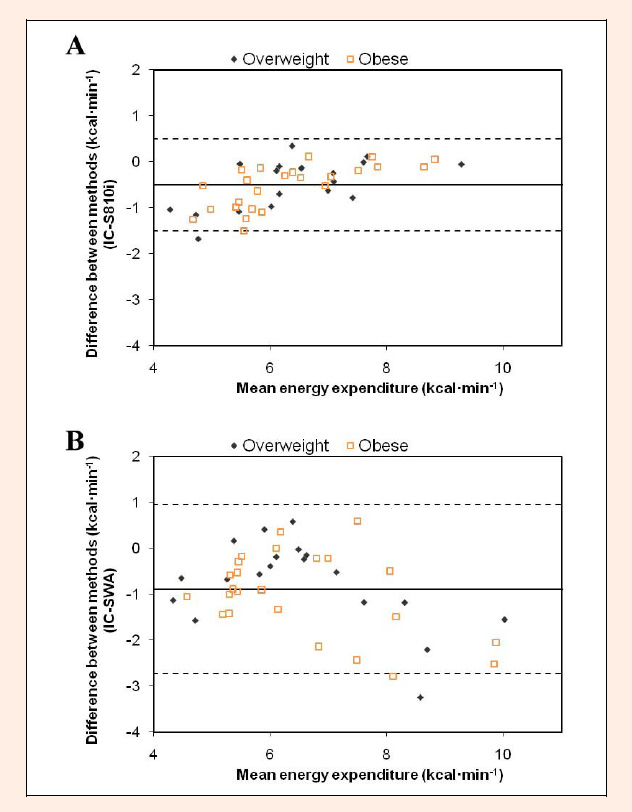
Figure 2. Bland-Altman bias plot between Polar S810i estimate and IC measurement for rowing energy expenditure at 50% VOmax. 95% Limits of Agreement = -1.50 to 0.49; 95% CI = -0.73 to –0.28 B) Bland-Altman bias plot between SWA estimate and IC measurement for rowing energy expenditure at 50% VOmax. 95% Limits of Agreement = -2.73 to 0.94; 95% CI = -1.30 to -0.49. The middle solid line represents the mean difference between the methods, and the dashed lines represent the 95% limits of agreement.