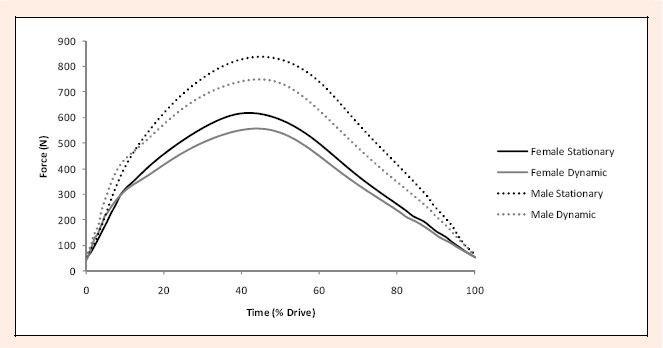
Figure 2.
Normalized and averaged force-time profiles for women and men during the drive phase of the stroke on the stationary and dynamic ergometers.