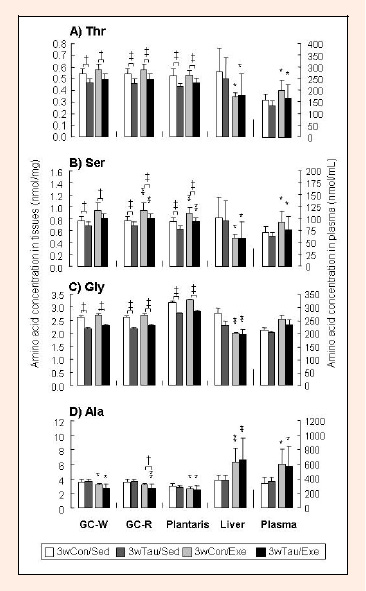
Figure 2. Abbreviations: GC-W; white portion of gastrocnemius muscle, GC-R, red portion of gastrocnemius muscle. See the legend of for other abbreviations. Values are shown as the mean ± SD. Differences were analyzed by two-way ANOVA followed by Bonferroni’s post-hoc analysis. † with bar, p < 0.05; ‡ with bar, p < 0.01 for the non-supplemented vs. taurine-supplemented groups in the respective conditions. * without bar, p < 0.05; ** without bar, p <0 .01, for the exercised groups versus the respective sedentary group.