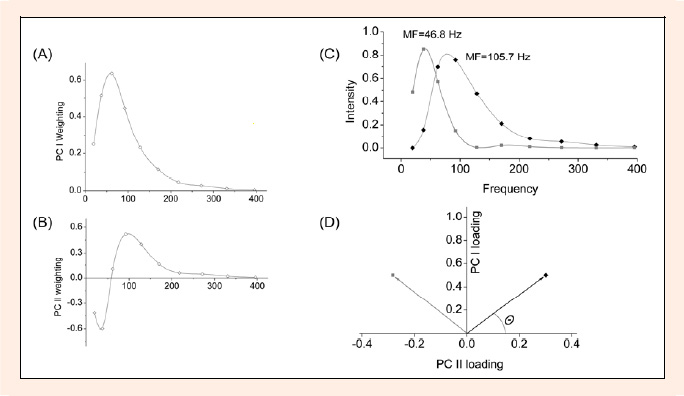
Figure 2. Principal component representation of EMG frequency spectra. Weighting for (A) the first principal component (PC I) and (B) the second principal component (PC II). (C) EMG-intensity spectra that can be reconstructed from vector products of the PC weightings shown in (A&B) with 0.5 PCI + 0.3 PCII shown in black and 0.5 PC I – 0.28 PC II shown in grey. The mean frequencies (MF) for the reconstructed spectra are shown. (D) Vector representation of the spectra in (C) following the same colors and symbols as in (C). The angle θ¸ is a measure of the relative PC I and PC II loading scores and of the myoelectric frequency