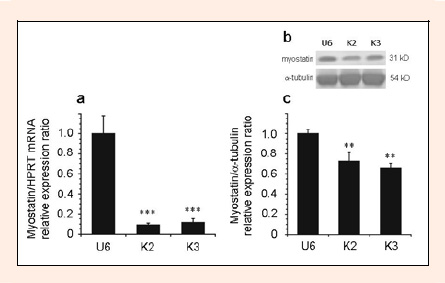
Figure 2. mRNA and protein expression level of myostatin in the tibialis anterior muscle, two weeks after introduction of knockdown plasmids (n=12 per group). a Myostatin mRNA expression levels, which were normalized to HPRT expression, were denoted as the myostatin/HPRT ratio. b Representative Western blot patterns of myostatin and α-tubulin. c Myostatin protein levels, normalized to the level of α-tubulin. ** p < 0.01 vs U6 control, *** p < 0.001 vs U6 control.