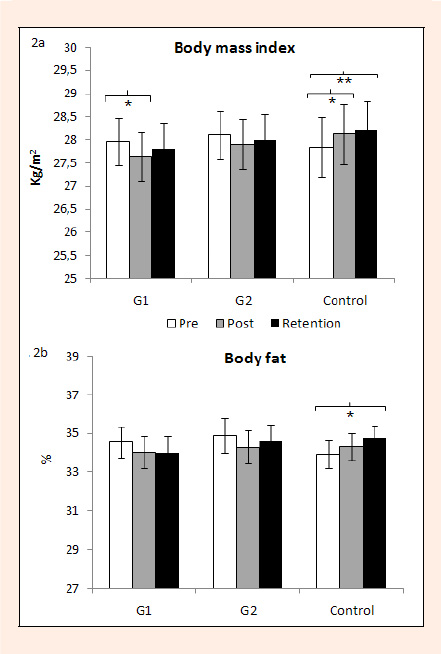
Figure 2. Graphic representation of the single effect of Time (pre = initial measurement, post = 6 weeks after pedometer use, and Retention = up to 12 weeks without pedometer) in G1 = own pedometer, G2 = borrowed pedometer, and Control Group. * p < 0.05, ** p < 0.01 stand for intra-group differences in the studied variables.