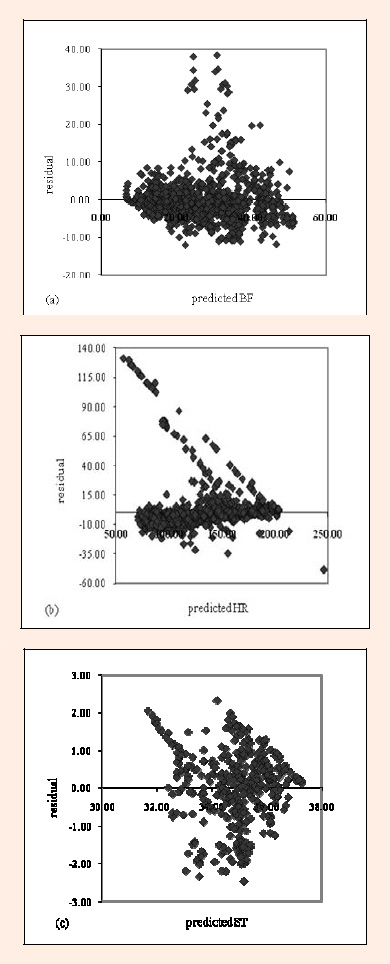
Figure 2.
Residual versus predicted plot demonstrating the relationship for (a) BF, (b) HR, and (c) ST.