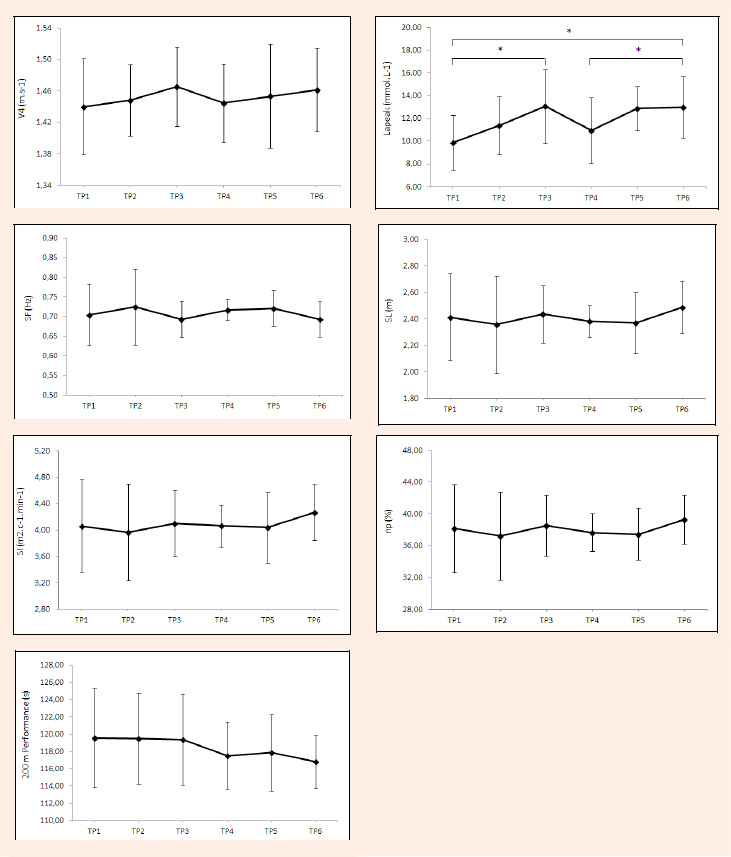
Figure 2.
Variations on energetics, biomechanics and performance throughout the two years of training. * indicates significant different from TP to TP (p = 0.02), from TP to TP (p = 0.05) and from TP to TP (p = 0.02).