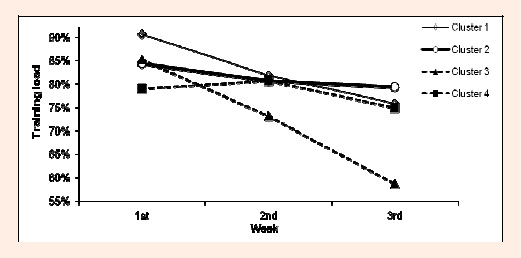
Figure 2. Change in total training load in the four clusters during the overload training period. Cluster 1 (continuous line with white diamond shapes, 32 periods) indicates a high training load peak during the 1 week associated with a linear fast decay training load design. Cluster 2 (continuous line with white circles, 26 periods) indicates a medium training load peak during the 1 week associated with a linear slow decay training load design. Cluster 3 (broken line with black triangles, 9 periods) revealed a medium training load peak during the 1 week associated with a fast decay logarithmic design. Cluster 4 (broken line with black squares, 18 periods) shows a low training load peak during the 1 week, followed by an increase and then a decrease in the training load design. ∆P for design 2 (MP, SD) was significantly higher than ∆P for design 4 (LP, ID).