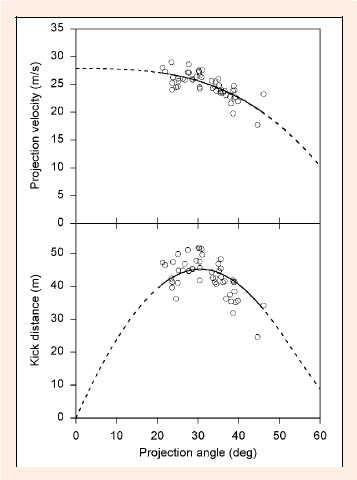
Figure 2. Plot (top) shows the decrease in the projection velocity of the ball as the player used a higher projection angle. The fitted curve is from . Plot (bottom) shows the relationship between the measured horizontal kick distance and the projection angle. Also shown is the curve of kick distance that was calculated from the relationship between projection velocity and projection angle in plot (a). For this player the calculated optimum projection angle for attaining the greatest kick distance (with the ball landing on the ground) is 30.6° (95% confidence limits ±1.9°).
