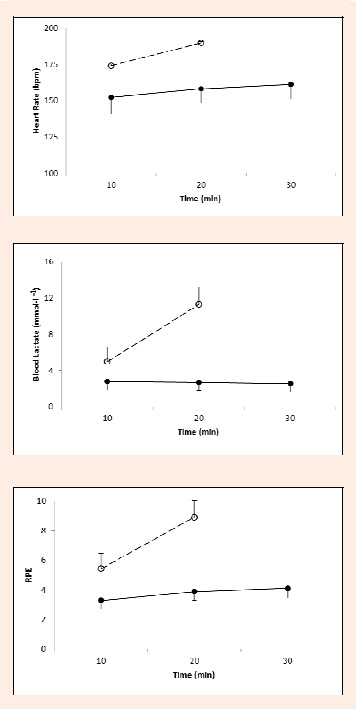
Figure 2. Mean (±SD) for heart rate, blood lactate concentration and RPE during the ≤VT (closed symbols, solid lines) and ≥RCT (open symbols, dashed lines) runs in Phase 2. The ≥RCT runs are plotted using the mean time for the completion of the run. * Denotes significance at p < 0.05
