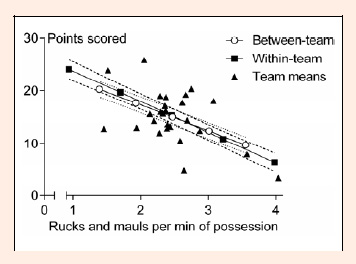
Figure 2. Example of strong between- and within-team relationships between a performance indicator (rucks and mauls per min of possession) and points scored in international rugby sevens matches. Each filled triangle represents the mean values for one of 26 teams. Best-fitting lines are shown with symbols representing increments of one between- and within-team standard deviation (open circles and filled squares, respectively). Dotted and dashed lines represent the 90% confidence limits of predicted mean points scored for the between- and within-team relationships, respectively.