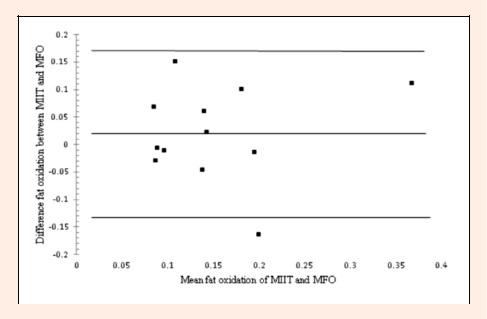
Figure 2.
Bland-Altman plot of the mean and difference of fat oxidation during MIIT and MFO.