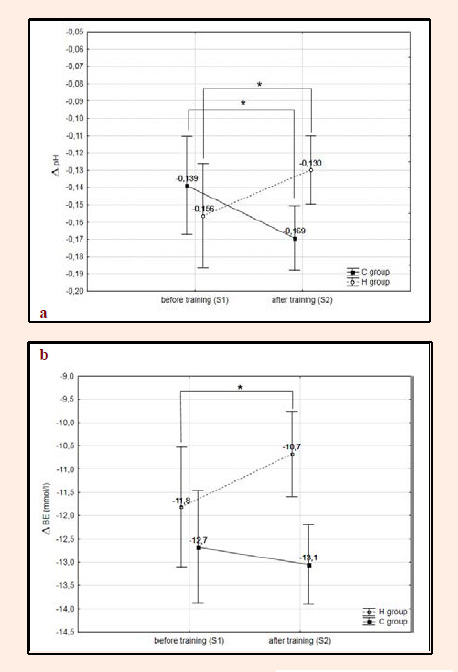
Figure 2. Changes in (a) pH (∆pH) and in (b) base excess (∆BE) during the incremental test in the experimental group (H, n=7) and the control group (C, n=8) for the successive series of examinations. * p < 0.05 – statistically significant differences in relation to the initial measurements.