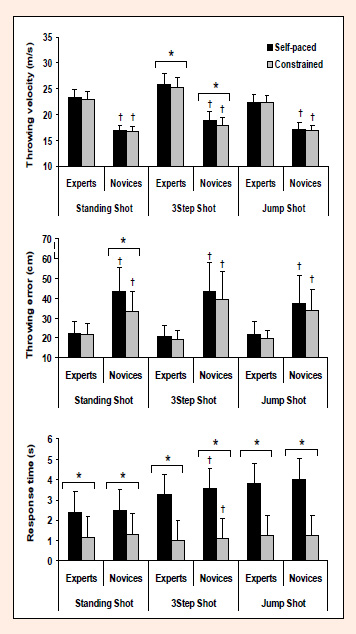
Figure 2. Mean and standard deviation of the individual averages for throwing velocity (Top), throwing error (Center) and response time (Bottom), in the self-paced (black bars) and the temporally constrained (grey bars) throws performed by the experts and the novices, in the Standing Shot, the 3Step Shot and the Jump Shot. (: significant differences between the experts and the novices (p e 0.05), * significant differences between the self-paced and the temporally constrained condition (p o 0.05).