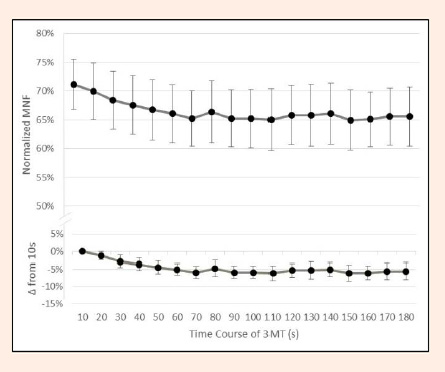
Figure 2.
Mean frequency (MNF) normalized to maximal MNF and change (∆) in MNF compared to the initial 10s epoch throughout the three-minute maximal cycling test (3MT). Data are reported as mean values ± 95% confidence intervals.