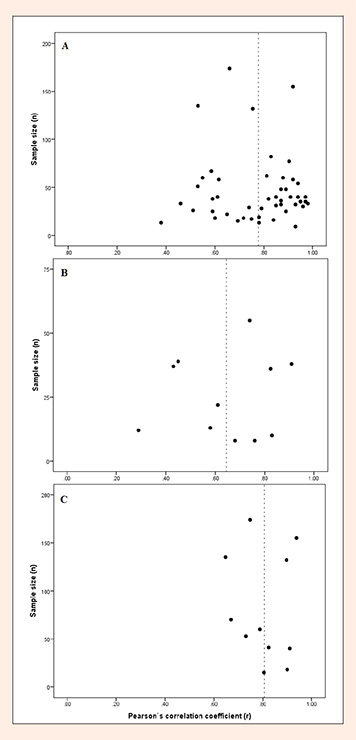
Figure 2. Scatter plot of sample size against criterion-related validity coefficients (r) for estimating maximal oxygen uptake: (a) Léger’s protocol with performance only score; (b) Léger’s protocol with multiple predictors; and (c) Eurofit protocol with performance score only. Dashed line represents mean values of validity coefficients.