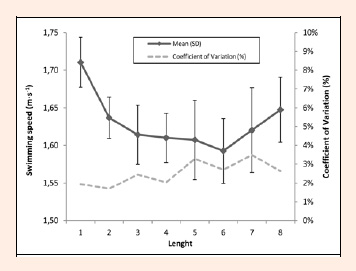
Figure 2.
Swimming speed (solid line) and its coefficient of variation (dashed line) of each length. Values are expressed as means and vertical bars represent standard deviations.