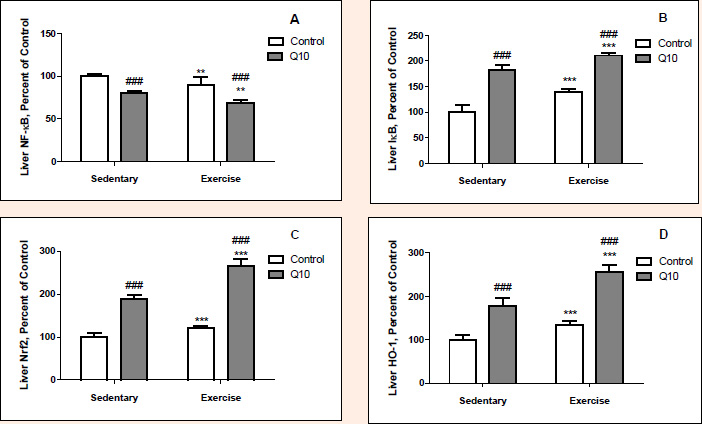
Figure 2. The Effect of Q10 on NFkB (Panel A), IkB (Panel B), Nrf2 (Panel C) and HO-1 (Panel D) protein expression levels of liver tissue after exercise training in rat. The intensity of the bands was quantified by densitometric analysis. Data are expressed as a ratio of normal control (sedentary untreated rats) value (set to 100 %). The bar represents the standard deviation of the mean. Blots were repeated at least 3 times (n=3) and a representative blot is shown. ** p<0.01, *** p<0.001, difference due to exercise, two way ANOVA. ### p<0.001, difference due to Q10 supplementation, two-way ANOVA.