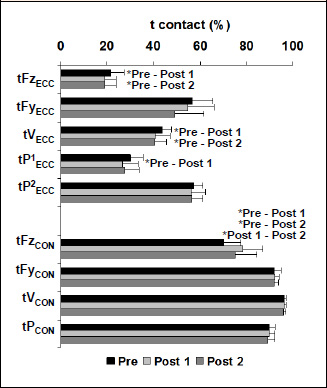
Figure 2. Mean (SD) of the relative time variables (% tCONTACT) in the eccentric (ECC) and concentric (ECC) contact phases. The significant pairwise differences (* p ≤ 0.05) among Pre (black bars), Post 1 (light grey bars) and Post 2 (dark grey bars) are noted.