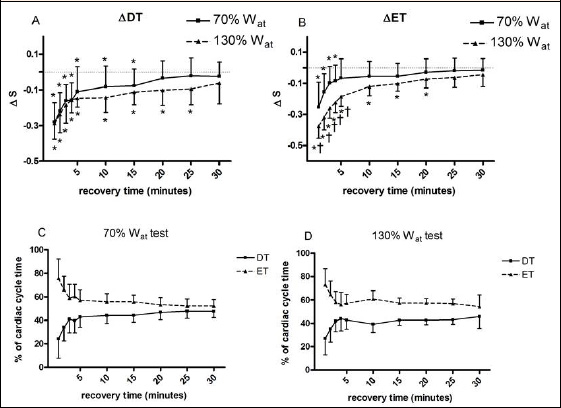
Figure 2. Changes from baseline in diastolic time (∆DT, panel A) and ejection time (∆ET, panel B) during 30 recovery minutes following the 130%Wat and the 70%Wat tests. A horizontal dotted line represents the pre-exercise level. Panel C and D represent the percent of the total cardiac cycle duration of DT and ET. Values are mean ± SD. * = p < 0.05 vs. pre-exercise; † = p < 0.05 vs. corresponding time point of 70%Wat.