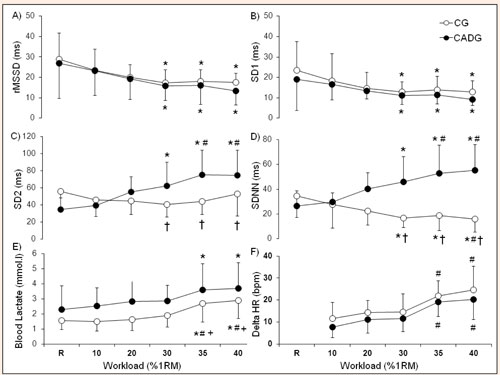
Figure 2. Data are presented as mean ± SD. Behavior of variables at isoload with the resistance increments in percentage of 1 repetition maximum (% 1RM). A) rMSSD = square root of the mean squared differences of successive RR intervals; B) SD1 = standard deviation of Poincaré plot perpendicular to the line of identify; C) SD2 = standard deviation of Poincaré plot along to the line of identify; D) SDNN = standard deviation of the mean of all normal RR intervals; E) Blood lactate; F) delta HR = HR of peak – HR of rest (pre-effort). CG = control group; CADG = cardiac artery disease group. *p<0.05 in relation to rest condition (R); # p < 0.05 in relation to 10% of 1RM; + p < 0.05 in relation to 20% of 1RM; † p < 0.05 CG in relation CADG (Two-way ANOVA for repeated measures).