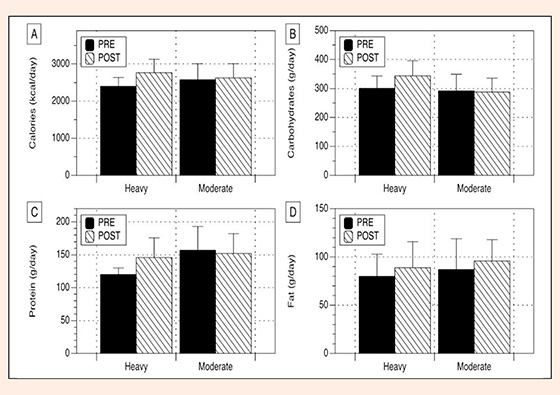
Figure 2.
Graphical representation of nutritional intake pre- and post-intervention for HEAVY and MODERATE, mean (±SD).