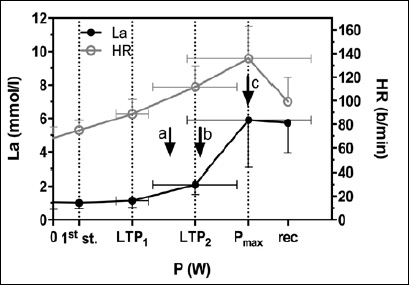
Figure 2. Performance curves for lactate and heart rate during the incremental exercise test (IET). The three phases of lactate metabolism are separated by the first (LTP1) and second lactate turn point (LTP2). Values are means ± SD. Exercise intensities for both HIIE modes and CE were set with respect to PLTP1, PLTP2, and Pmax from IET. Arrow a represents Pmean for all three exercise protocols; arrow b represents Ppeak for long HIIE; arrow c represents Ppeak for short HIIE. La, blood lactate; HR, heart rate; 1st st., first workload step; Pmax, maximum power output; rec, recovery.